Reporting
Annotate the result sheet, set the paper and the extents, reuse layouts as templates, and export to PDF, PNG, Excel and CSV.
The result view is a print sheet: what you see is what the PDF export contains.
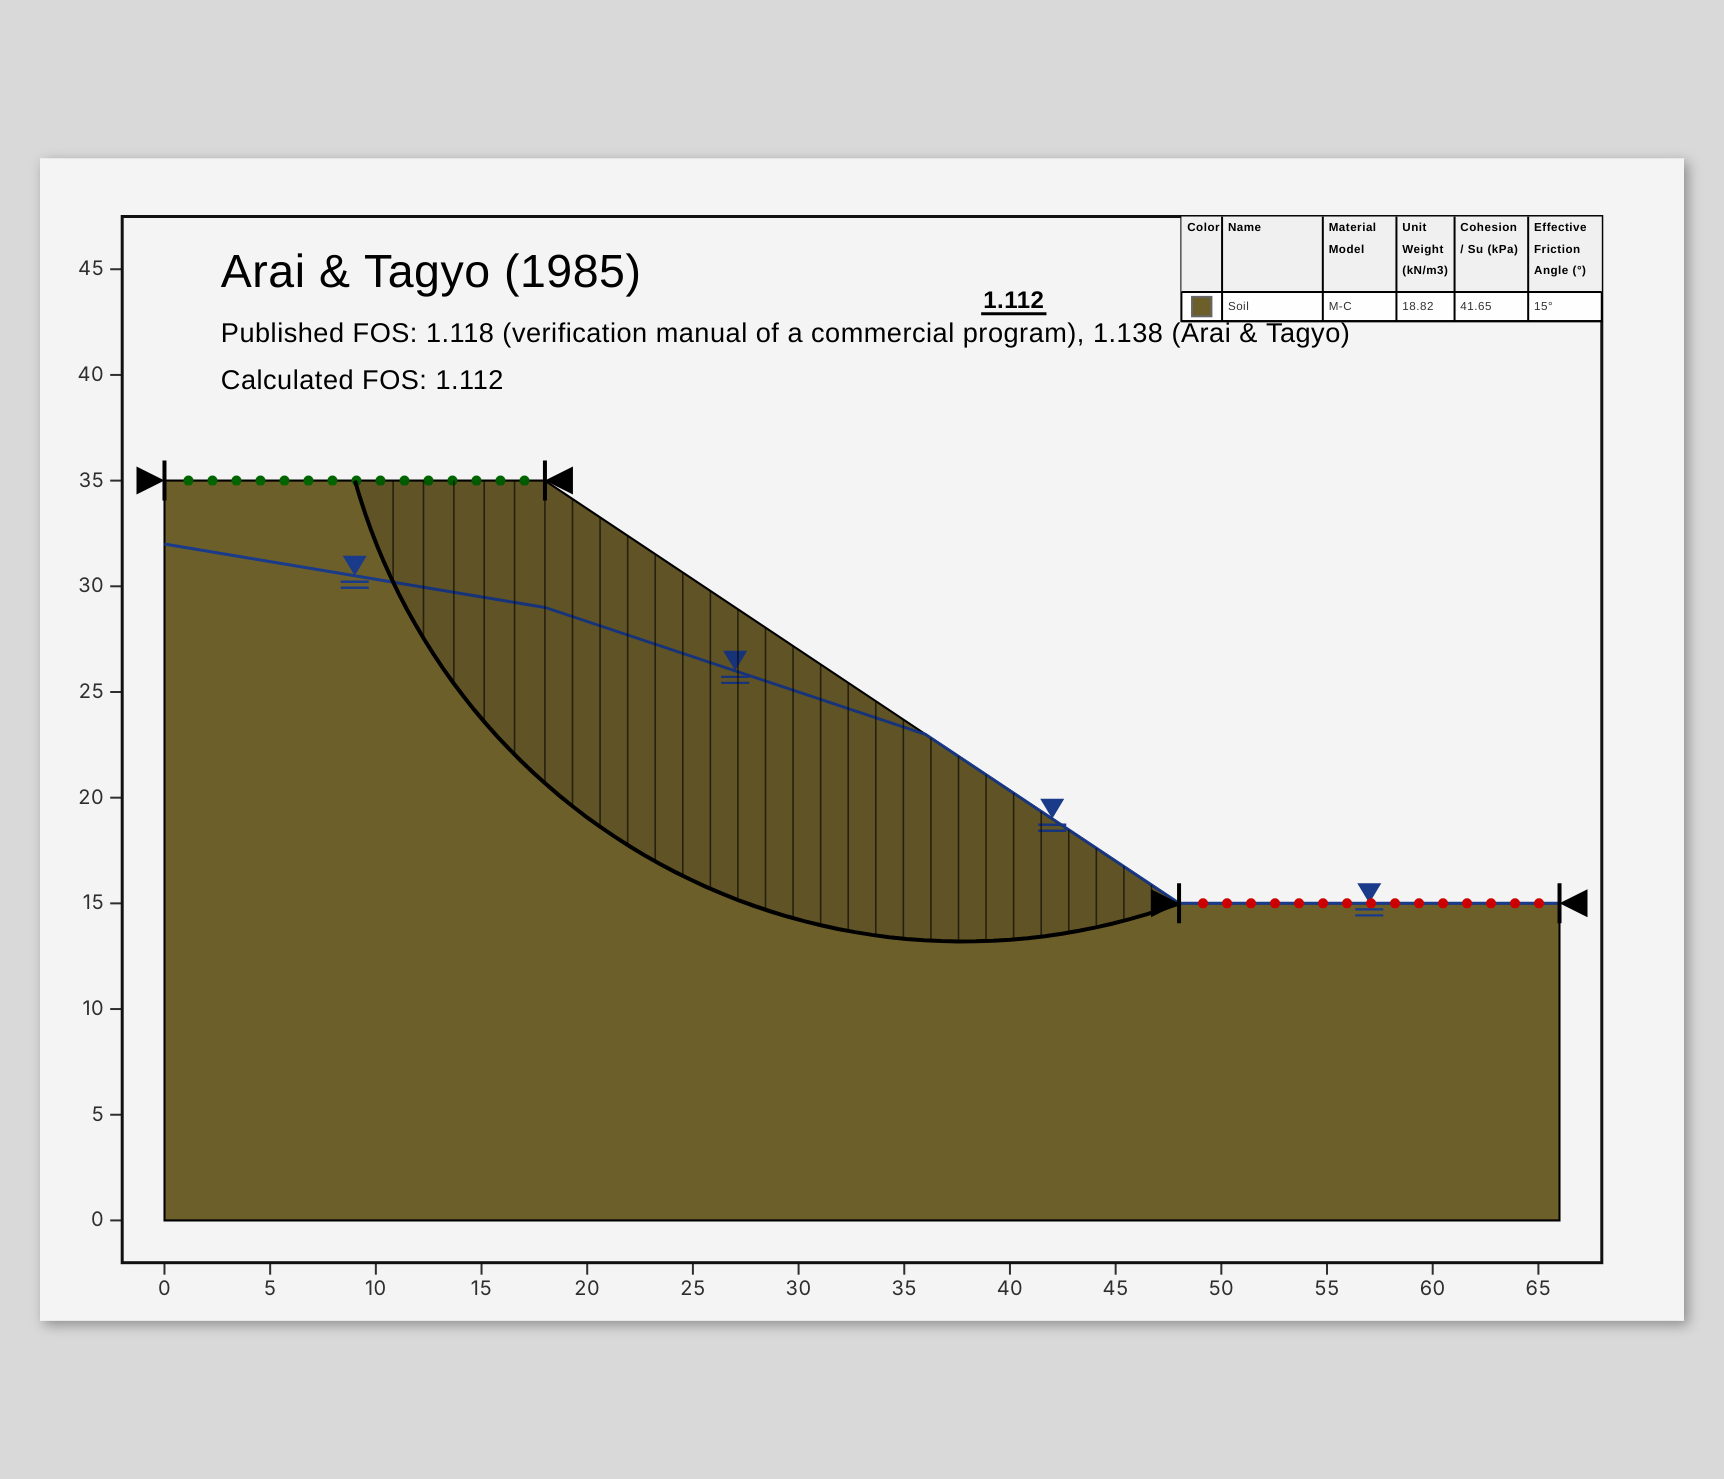
Paper and extents
Click an empty part of the sheet to select the paper and edit it under Properties in the sidebar, or open Results › Display › Settings (Paper, Grid & Ticks, Plot Extents):
- Paper size A4 to A0 and orientation portrait or landscape.
- Plot extents: Left X, Right X, Bottom Y and Top Y, the part of the model shown on the sheet. The scale of the drawing follows from the extents and the paper. Use model bounds, in the sidebar Properties of the selected paper, fits the whole model.
- Grid & ticks: the tick spacing (Auto when empty) and the number of minor ticks.
Zooming and panning in result mode move the sheet on the screen; they do not change the drawing.
Annotations
Results › Annotations adds:
- Text: a text block. Choose font, size, bold, italic and colour.
- Material Table: the materials with their properties. Choose the text size and the columns.
- Plot: a chart of slice data along the critical surface, placed on the sheet.
- Color Bar: the factor-of-safety colour scale for All surfaces.
Drag annotations to place them; their position is stored as a percentage of the sheet, so they stay in place on any paper size. Select several with Ctrl+click and right-click to align them. The arrow keys nudge the selection, Delete removes it. The Annotations list in the sidebar shows all of them; the Properties section edits the selected one.
Text fields
Text annotations can show values from the model. They are replaced when the sheet is drawn:
| Field | Shows |
|---|---|
#Title, #Subtitle, #Client, #ProjectNumber, #Revision, #Author, #Checker, #Date, #Description | The model's project information (right-click the model in the Explorer, then Properties) |
#Method | The analysis method |
#FOS, #MinFOS | The factor of safety |
#name | The value of the parameter name |
{{expression}} | The value of an expression with parameters, for example {{H / 2}} |
\n starts a new line. A new model starts with a title (#Title), a subtitle (#Subtitle) and a material table.
Templates
A template stores the layout of the sheet: annotations, display options, paper and extents.
- Results › Templates › Export saves the layout of the active model as
view-template.json. - Results › Templates › Import applies a saved layout to the active model.
Use a template to give every model and every project the same title block and layout.
Export
Results › Export › PDF saves the sheet as a vector PDF. The menu next to it also has:
| Export | Content |
|---|---|
| Export as PDF | The sheet as a vector PDF, named after the model's title or project number |
| Export as PNG | The sheet as an image |
| Slice data (Excel) | The slices of the critical surface as an .xlsx table |
| Slice data (CSV) | The same as CSV |
| Slice data (CSV, ; and ,) | CSV with ; as the separator and , as the decimal mark |
The slice table has one row per slice with its geometry (x left, right and mid, width, top and base elevation, height, area, base angle and length), weight, surface load, base material, c, φ, pore pressure, effective normal force and shear strength. The header rows name the model, method, factor of safety and critical surface.