Reporting
Lay out the result sheet with annotations, set the paper and the extents, and export to PDF and Excel.
The result view is a print sheet. This tutorial lays it out for a report and exports it.
Start a new project with File › New and click ▶ Run.
1. The paper
Click an empty part of the sheet to select the paper. The Properties section of the sidebar shows its settings:
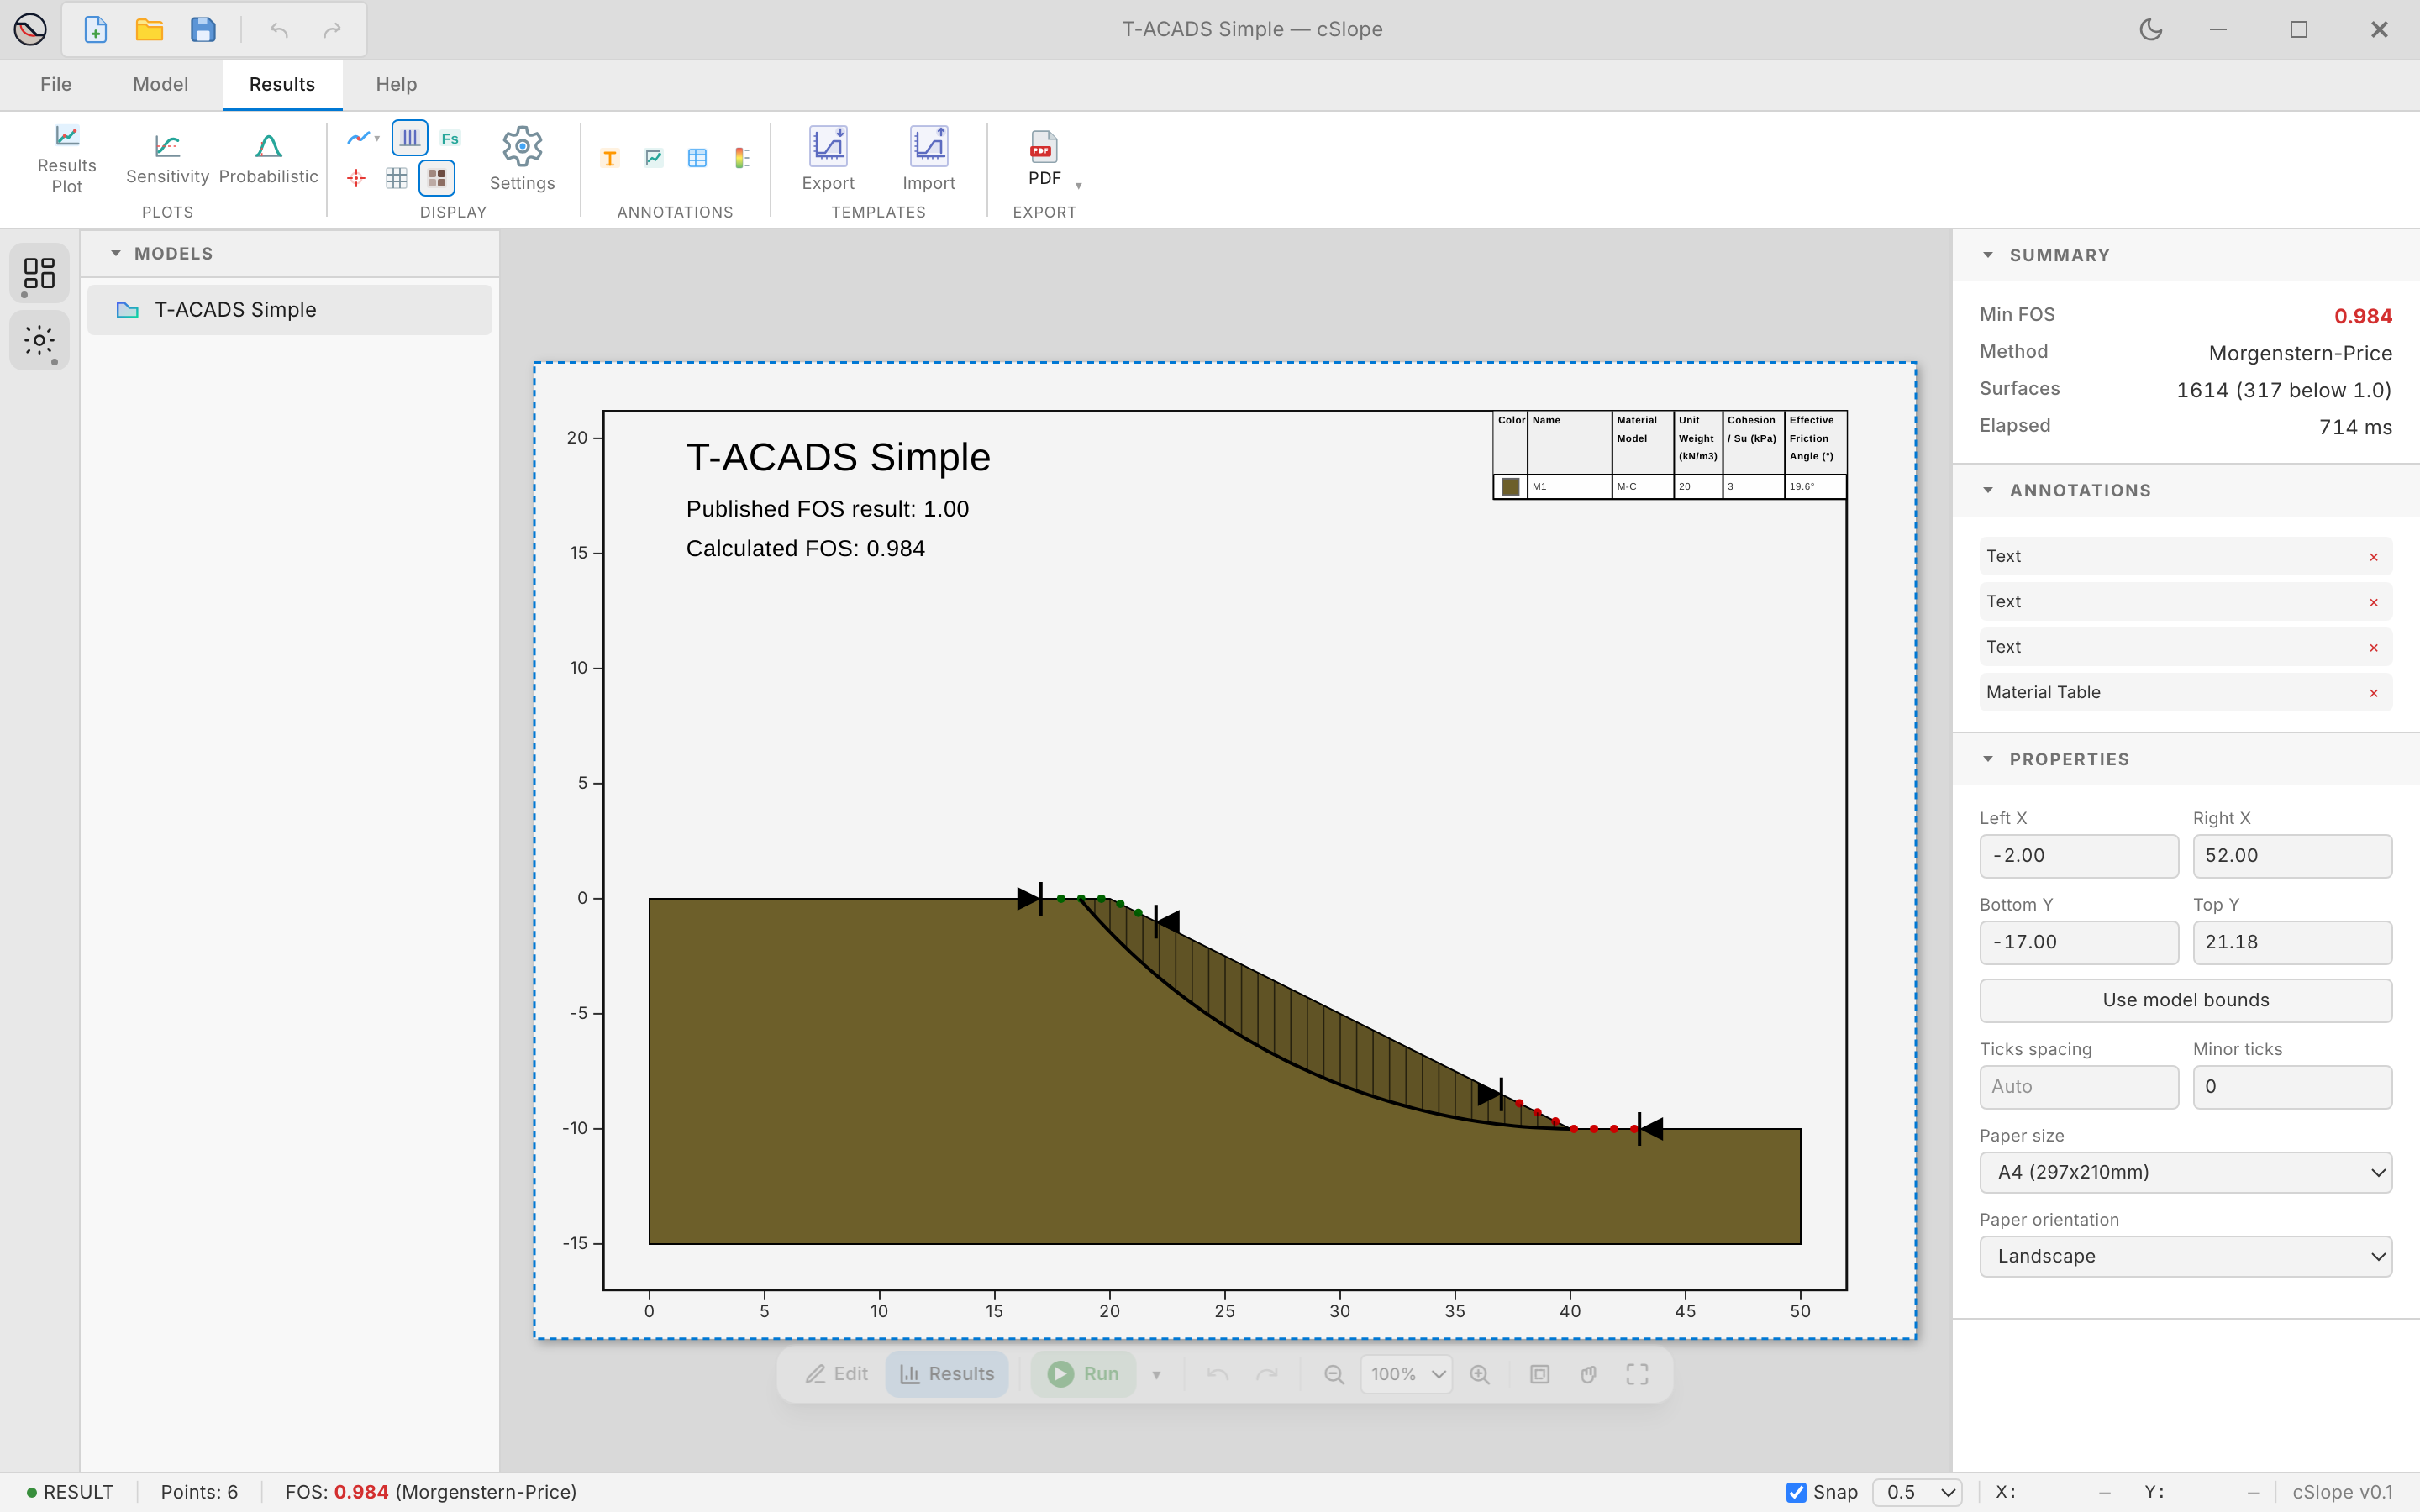
- Left X, Right X, Bottom Y, Top Y: the part of the model on the sheet. Use model bounds fits the whole model.
- Paper size and Paper orientation.
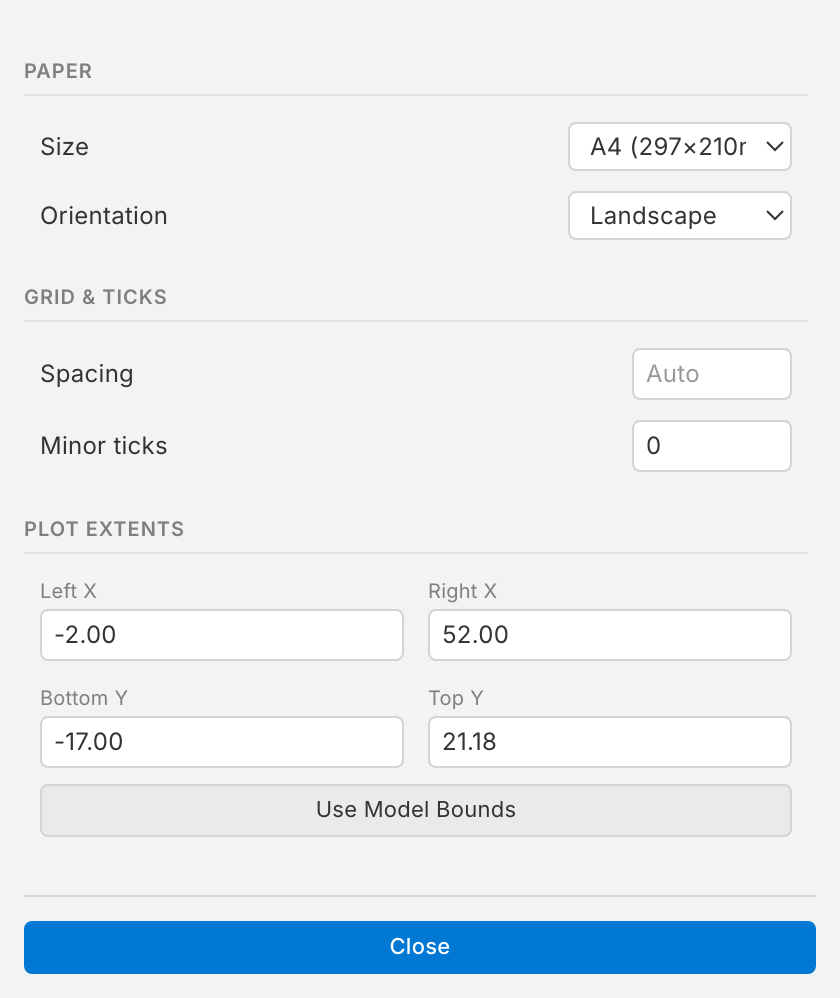
The same settings are in Results › Display › Settings:
2. Annotations
The example model's sheet already has a title, two lines of text with the published and calculated factors of safety, and a material table. Add more from Results › Annotations: text, a material table, a plot of slice data, or a colour bar.
Show all surfaces (Results › Display, surfaces list, All surfaces) and add a colour bar to explain the colours:
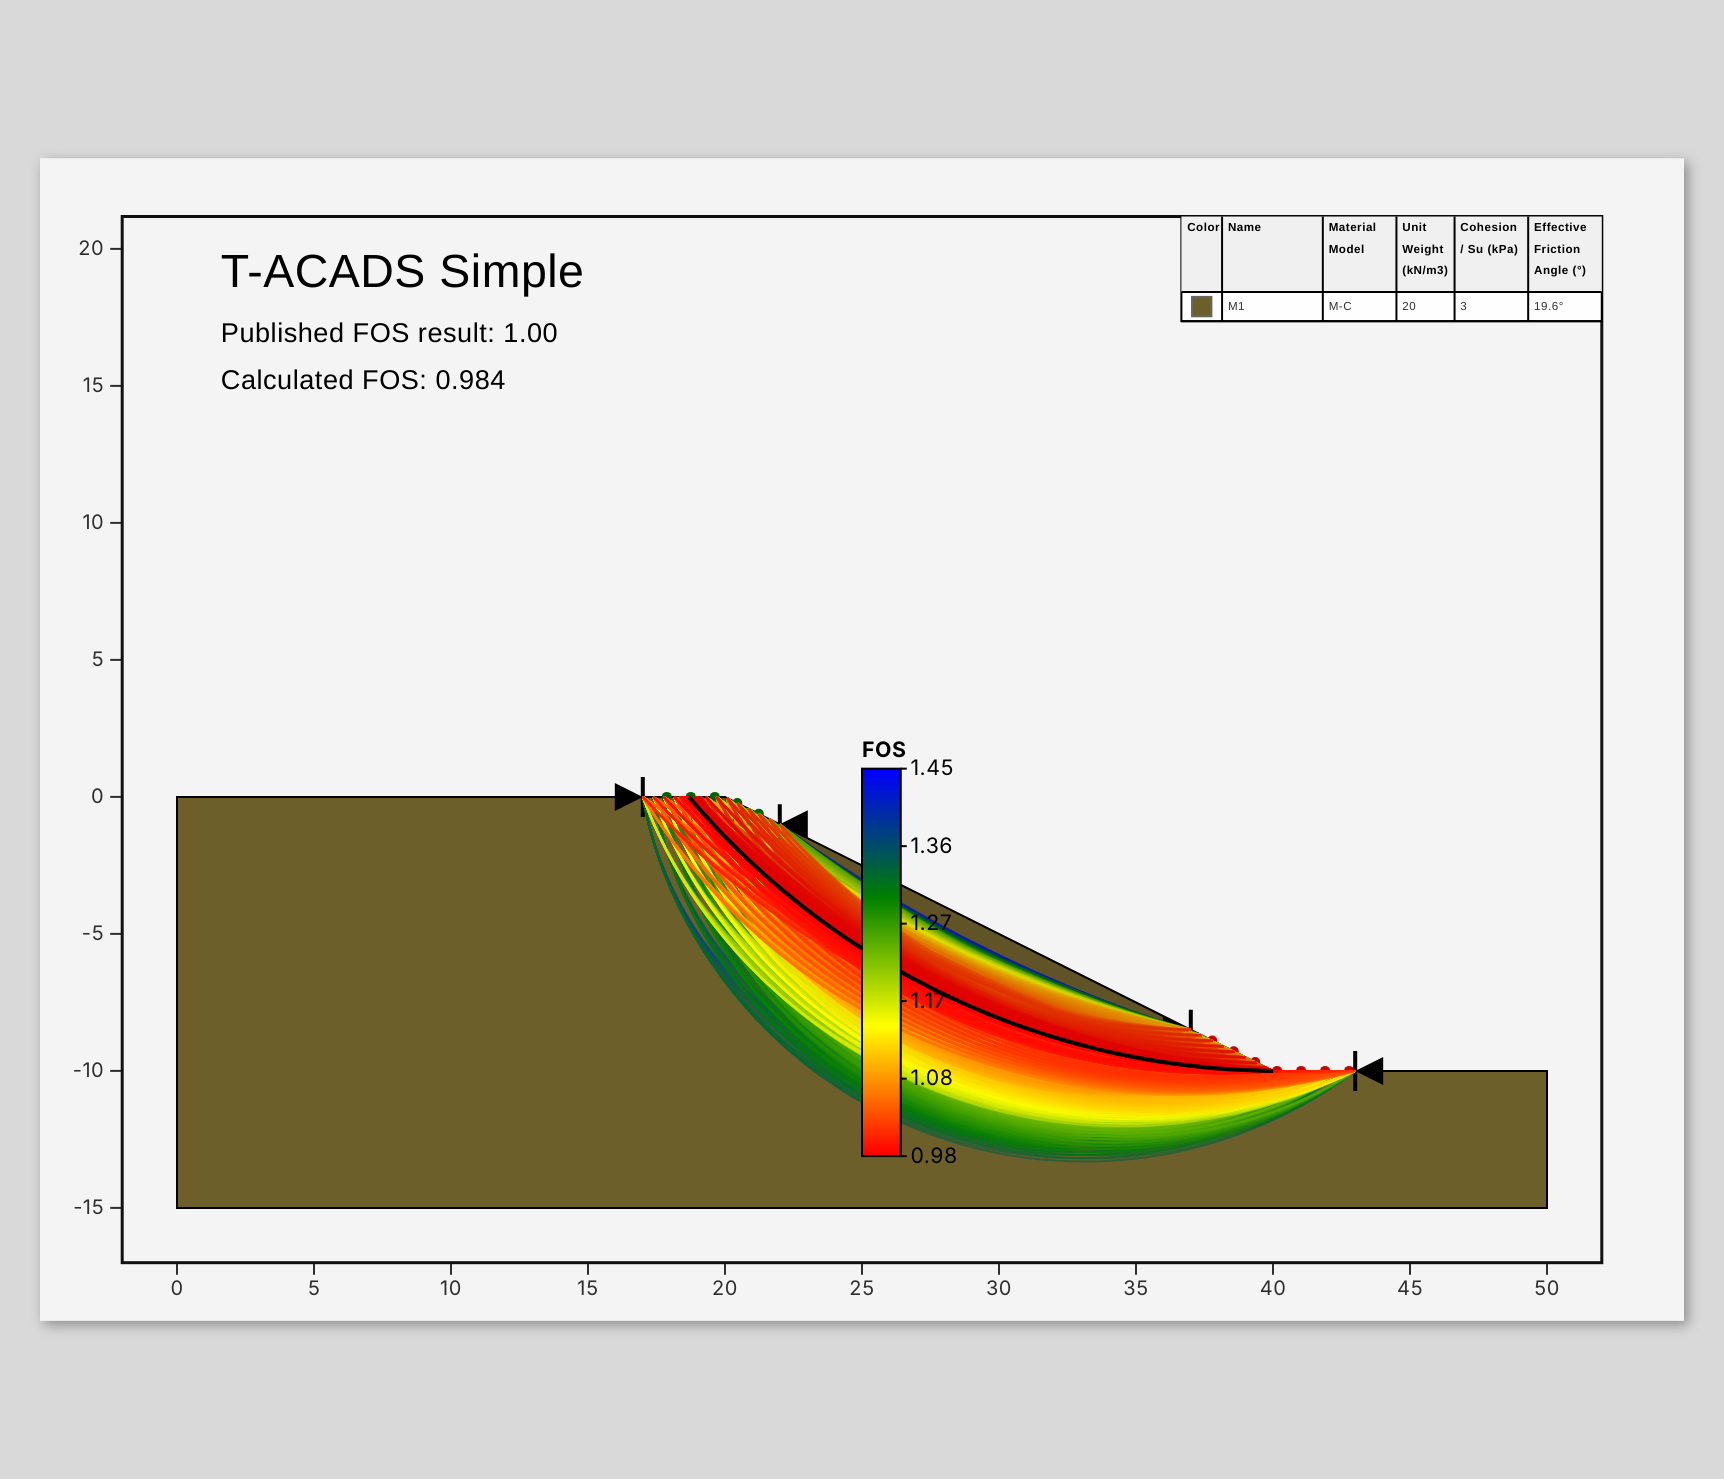
Drag annotations to place them. Select one to edit its text, font, size and colour in the sidebar. A text can show values from the model: #Title, #Client, #Revision, #Method, #FOS and others, and any parameter as #name. See Reporting for the list.
3. Reuse the layout
Results › Templates › Export saves the layout (annotations, display options, paper and extents) as a file. Import applies it to another model, so every model in a report gets the same title block.
4. Export
Results › Export › PDF saves the sheet as a vector PDF. The menu next to it has the other formats:
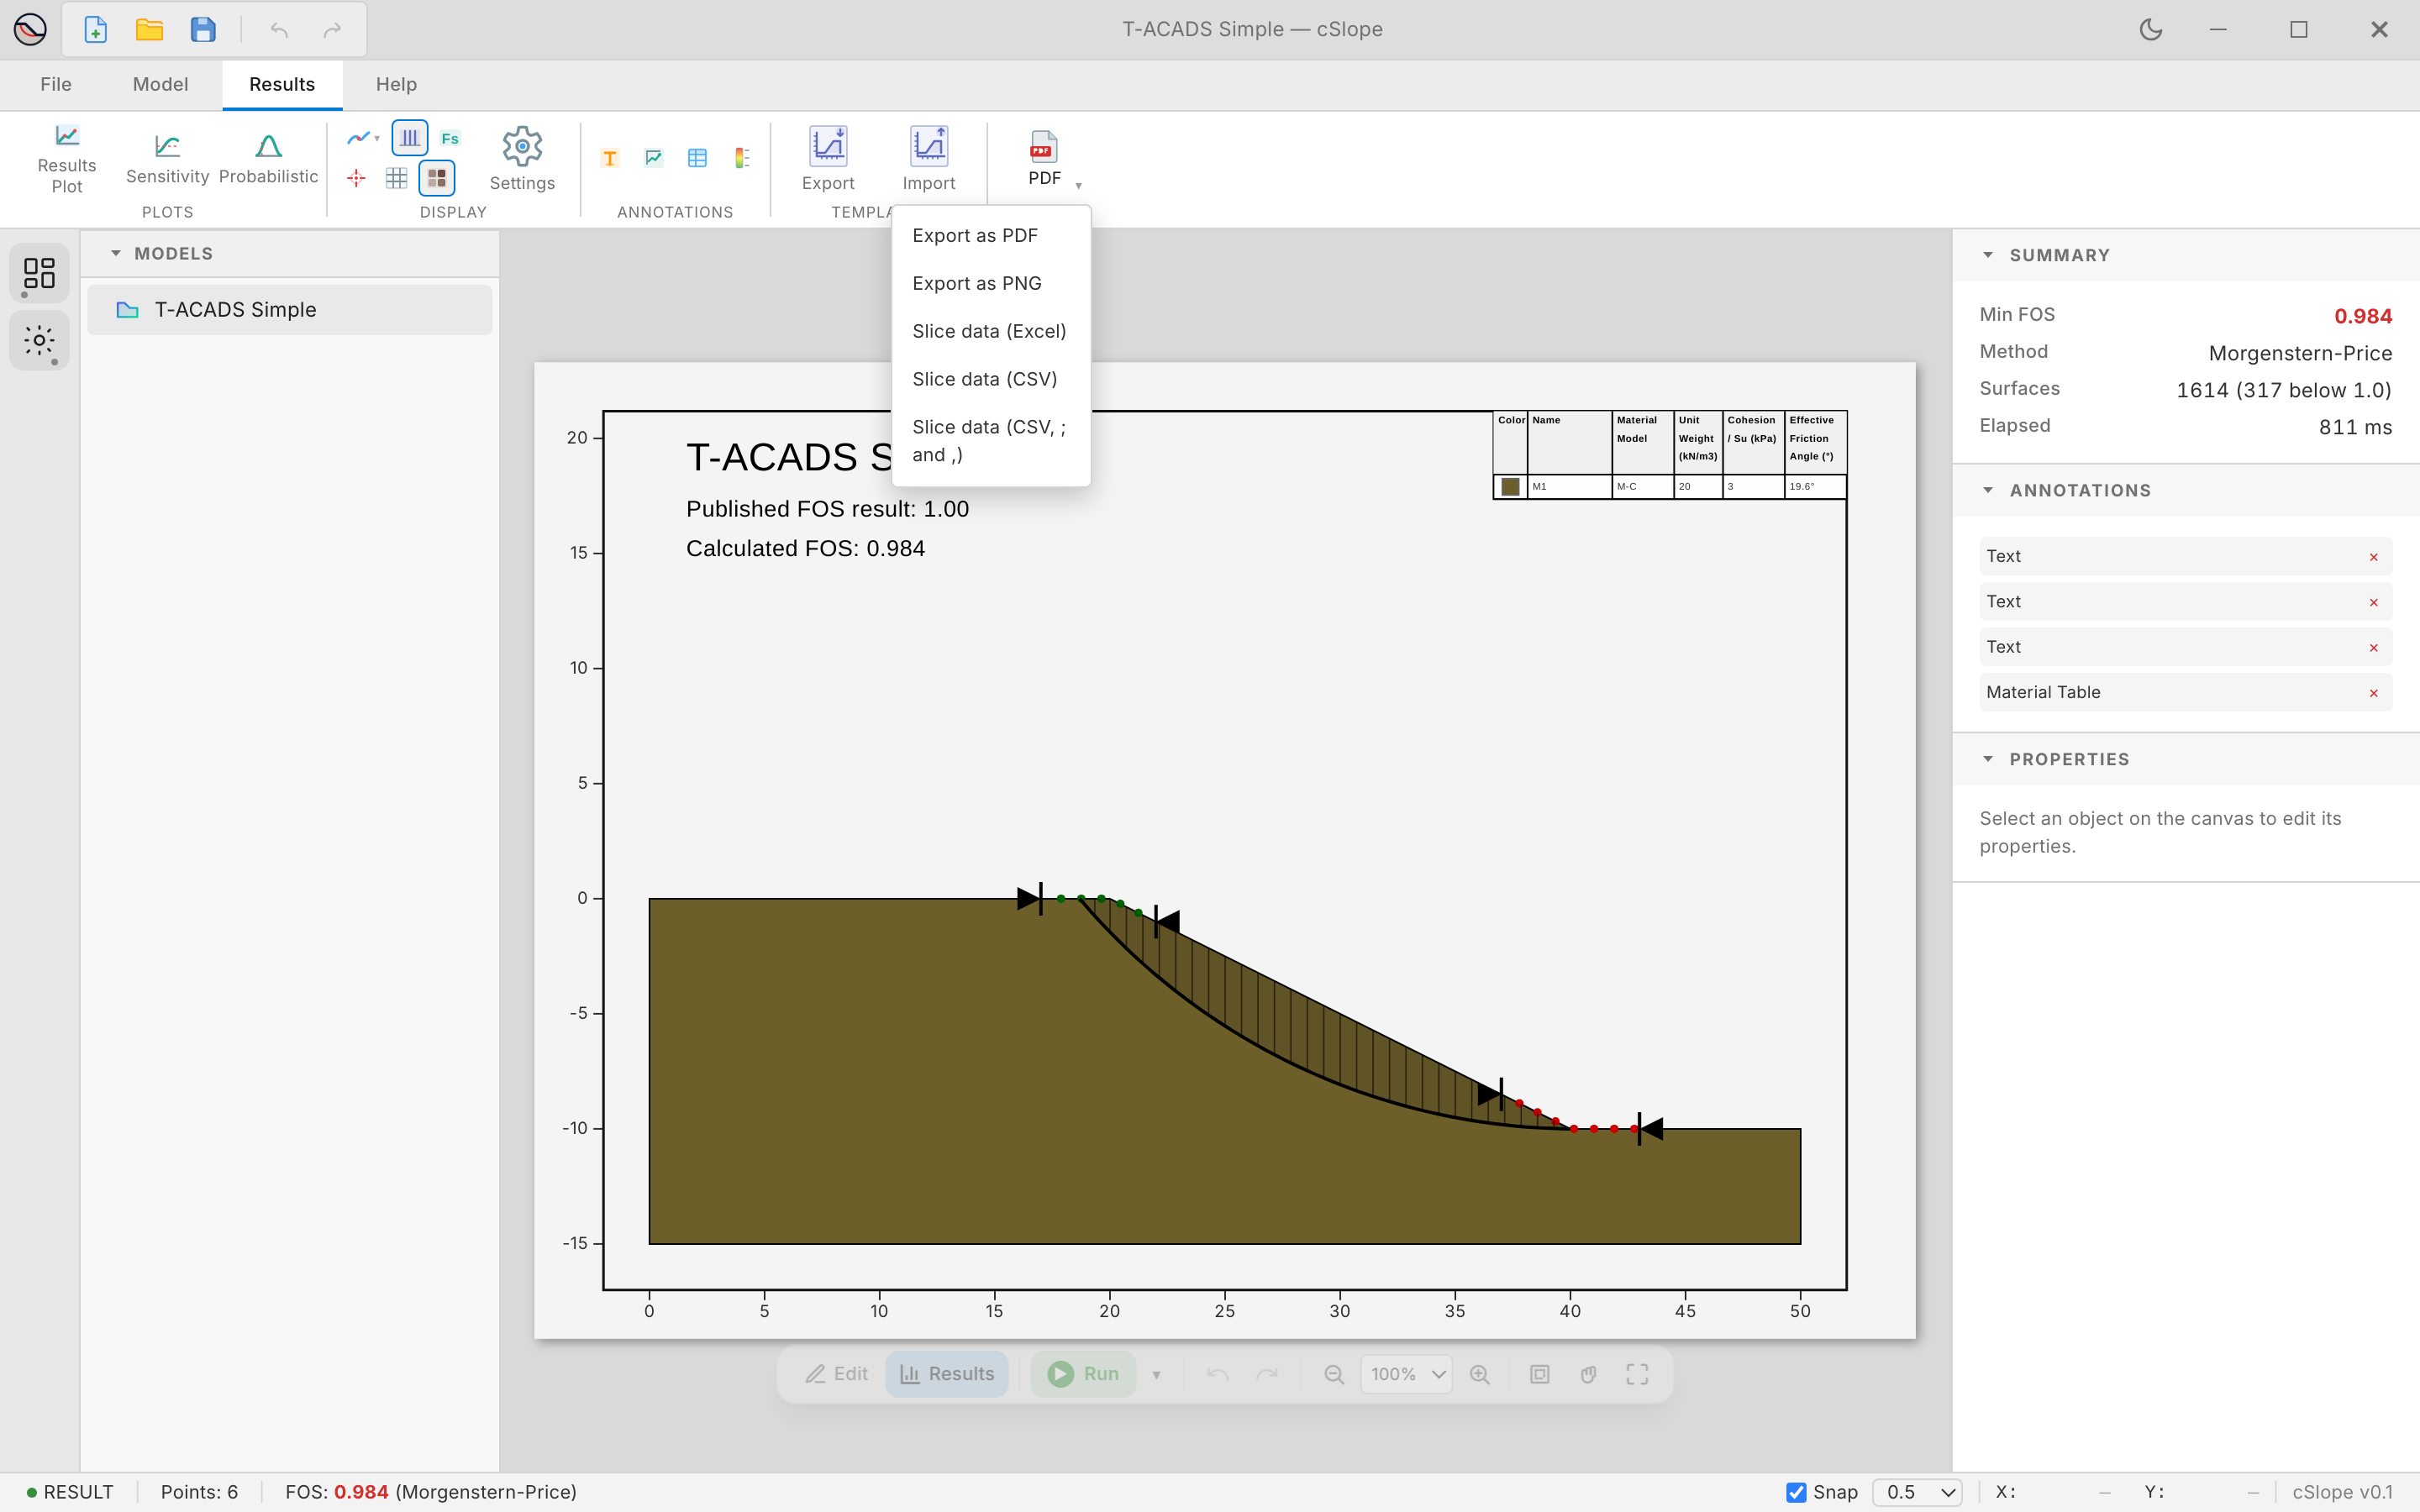
The slice table lists every slice of the critical surface with its geometry, weight, strength, pore pressure and forces, ready for a calculation appendix.