Sensitivity and probability
How much the factor of safety depends on one input, and the probability of failure when the inputs are uncertain.
Both analyses build on a finished model. Open them from Results › Plots.
Sensitivity analysis
Sensitivity runs the complete analysis, including the search, for a range of values of one input and plots the factor of safety against it.
- Under Vary, choose the input: any parameter, or a property of a material (unit weight, c, φ, Su and so on). The list shows each input's current value.
- Set From and To. They start at ±20 % of the current value.
- Set Values, the number of analyses between them (2–101, default 9).
- Click Run.
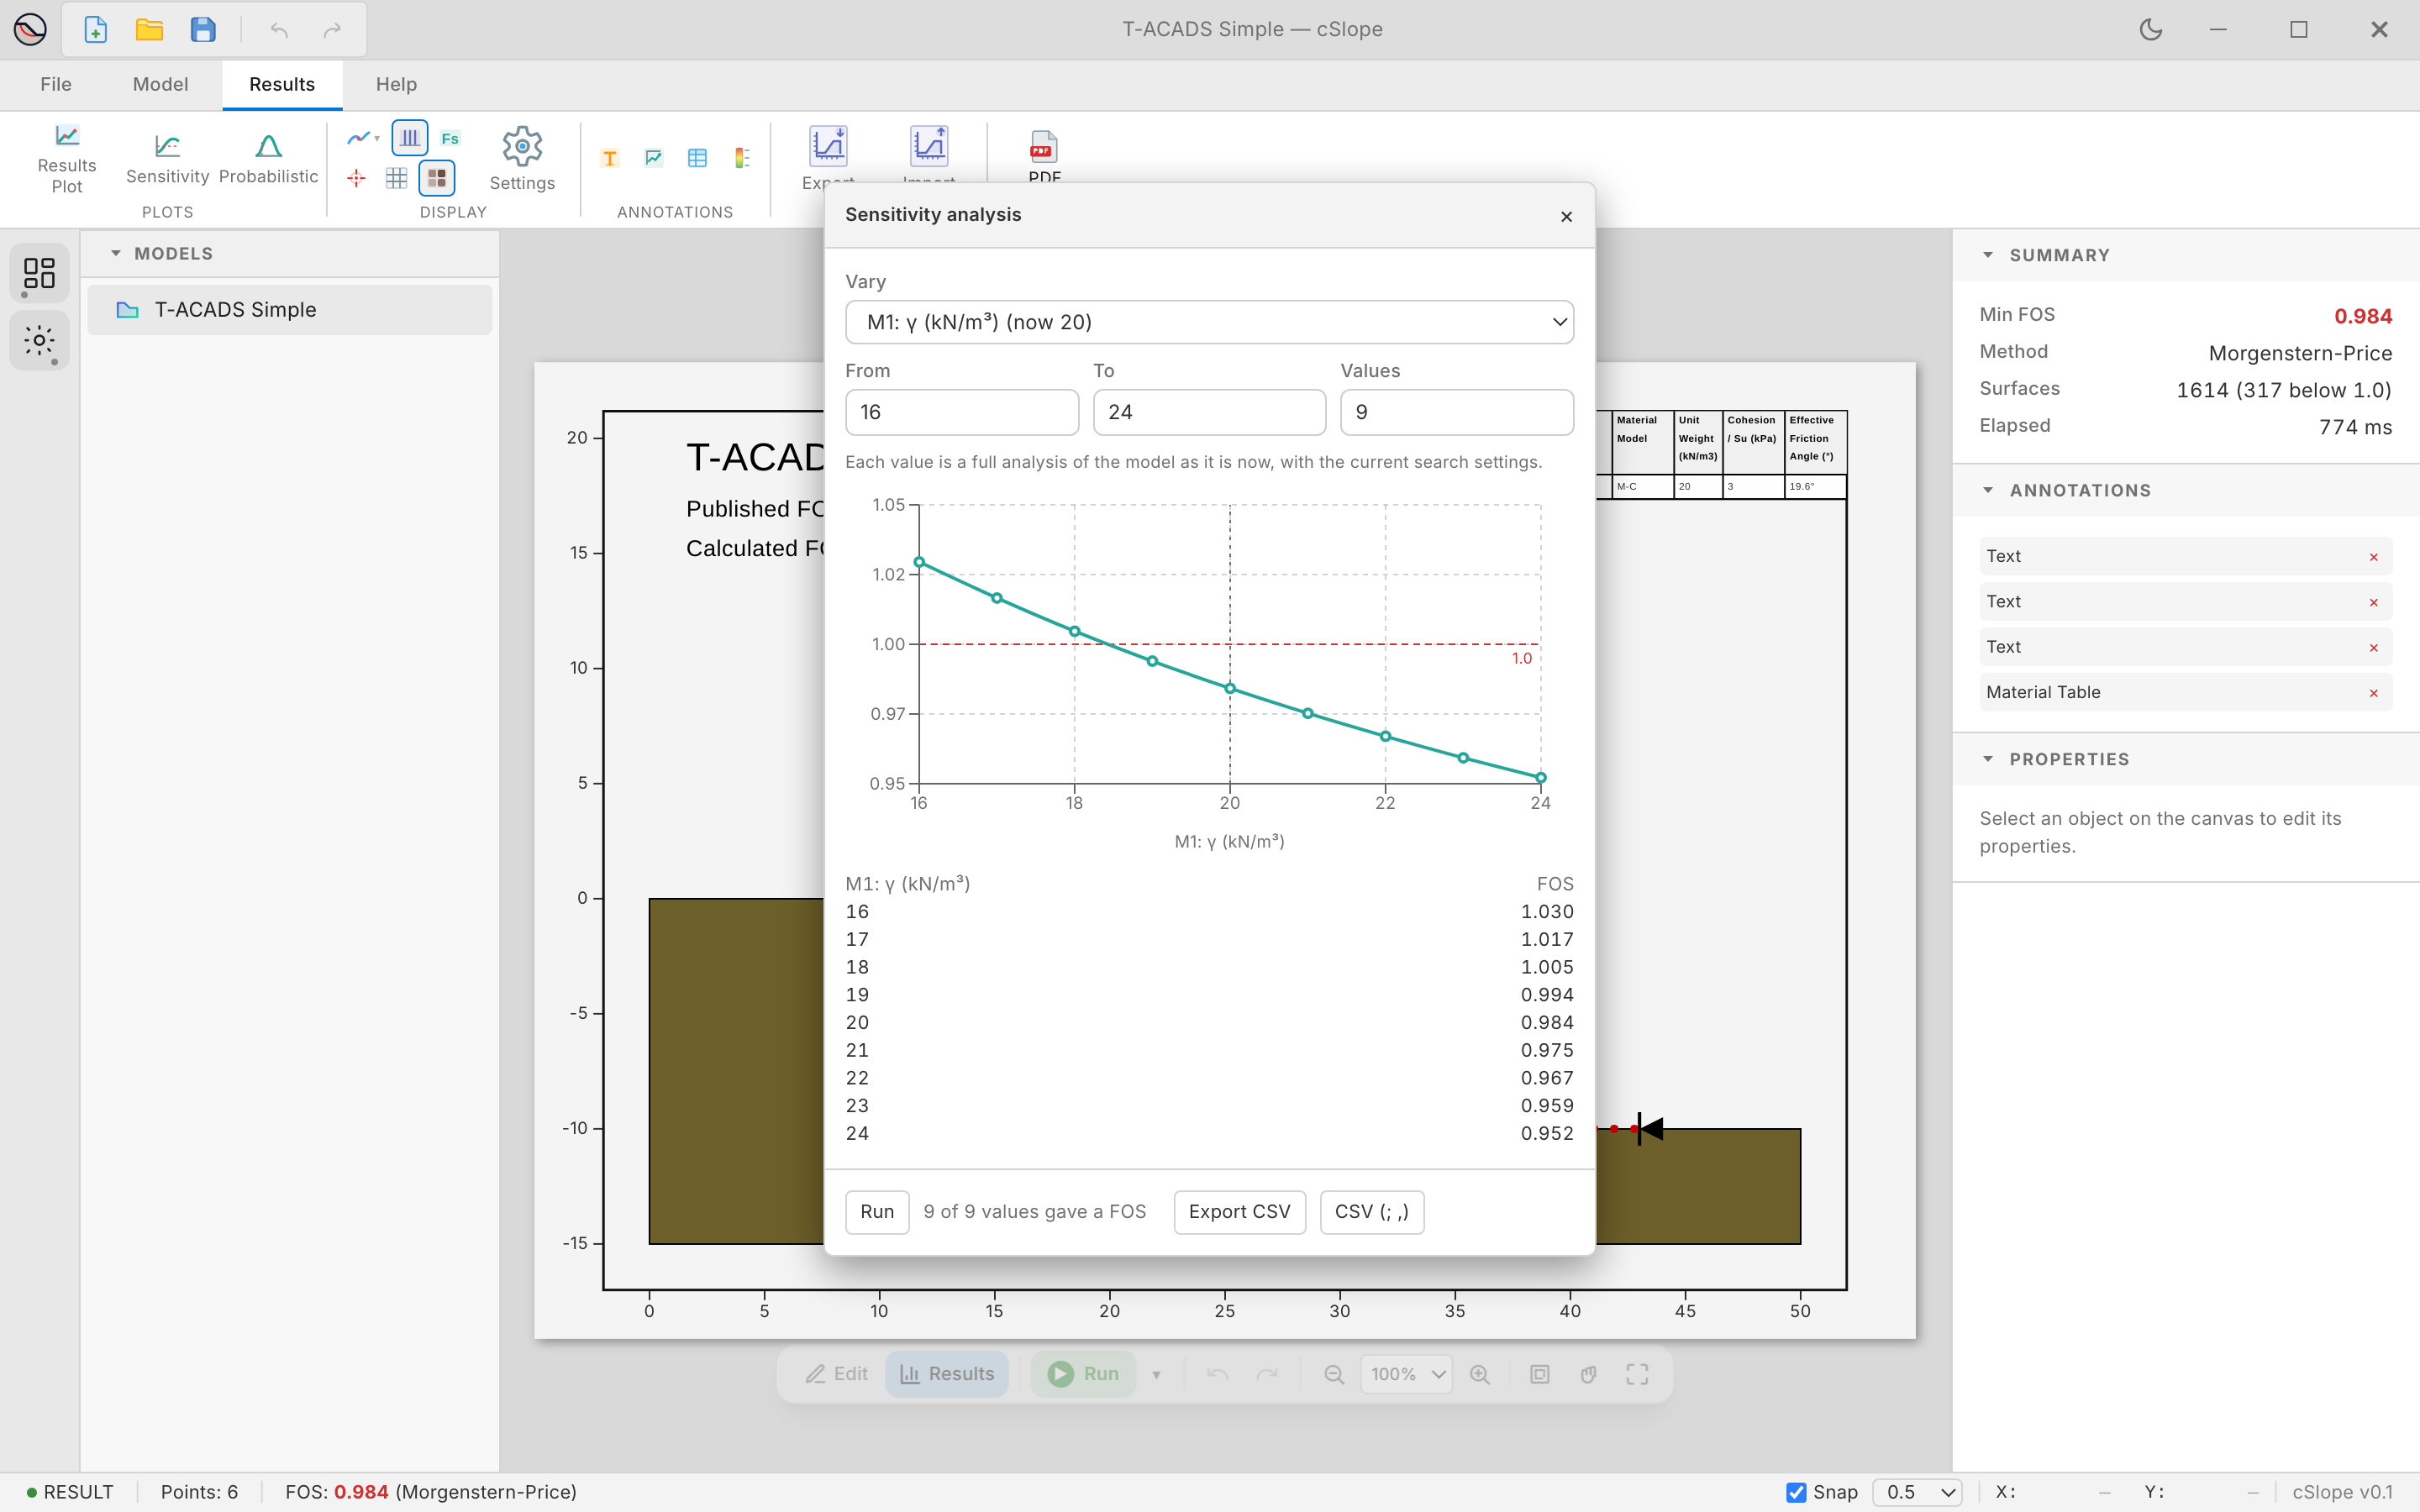
The chart shows the factor of safety against the value, with a line at 1.0. The table lists the values. Export CSV saves them (also with ; as the separator and , as the decimal mark, for spreadsheets in many European locales).
Tip
To vary a dimension, such as the height of an embankment or the depth of an excavation, define it as a parameter and use the parameter in the coordinates. The sensitivity analysis can then vary it like any other input.
Probabilistic analysis
Probabilistic treats material properties as random variables and computes the probability that the factor of safety is below 1.
Variables
The panel starts with one variable. Click + Add variable for more, and choose a material property in each row. Its mean is the value in the model. Enter its standard deviation σ (the default corresponds to a coefficient of variation of 5 % for unit weights, 10 % for friction angles and 25 % for other properties) and its Distribution, normal or lognormal. The distribution applies to Monte Carlo only; the Taylor series uses just the mean and σ.
Methods
- Taylor series: the factor of safety at the mean values and with each variable at its mean ± σ, 1 + 2n analyses for n variables. With Search the critical surface again for each value (default) each analysis is a full search; otherwise the critical surface at the mean values is reused. The Taylor series does not run when mean − σ of a strength or unit weight is negative; use Monte Carlo instead.
- Monte Carlo: one search at the mean values, then the given number of Samples (default 2000) analysed on that critical surface. The Seed makes the samples reproducible. Normal samples are truncated at zero.
Results
- the factor of safety at the mean values (and the mean of the samples for Monte Carlo),
- the standard deviation and coefficient of variation of the factor of safety,
- the reliability index β and the probability of failure, assuming a lognormal distribution of the factor of safety,
- the normal reliability index β = (μF − 1)/σF,
- for Monte Carlo, the share of samples with a factor of safety below 1 and a histogram of the samples,
- for the Taylor series, a table of the factor of safety at mean + σ and mean − σ of each variable, which shows which variables matter most.
The results can be exported as CSV. Sensitivity and probabilistic results are not saved with the project; run them again after opening it. The equations are on the theory page.