A slope with a water table
Add a piezometric line, see the pore pressure it gives along the slip surface, and how ponding works.
This tutorial uses a published example with a water table, from Arai & Tagyo (1985). Open it from Help › Benchmarks and click Arai & Tagyo (1985) in the Explorer.
1. The model
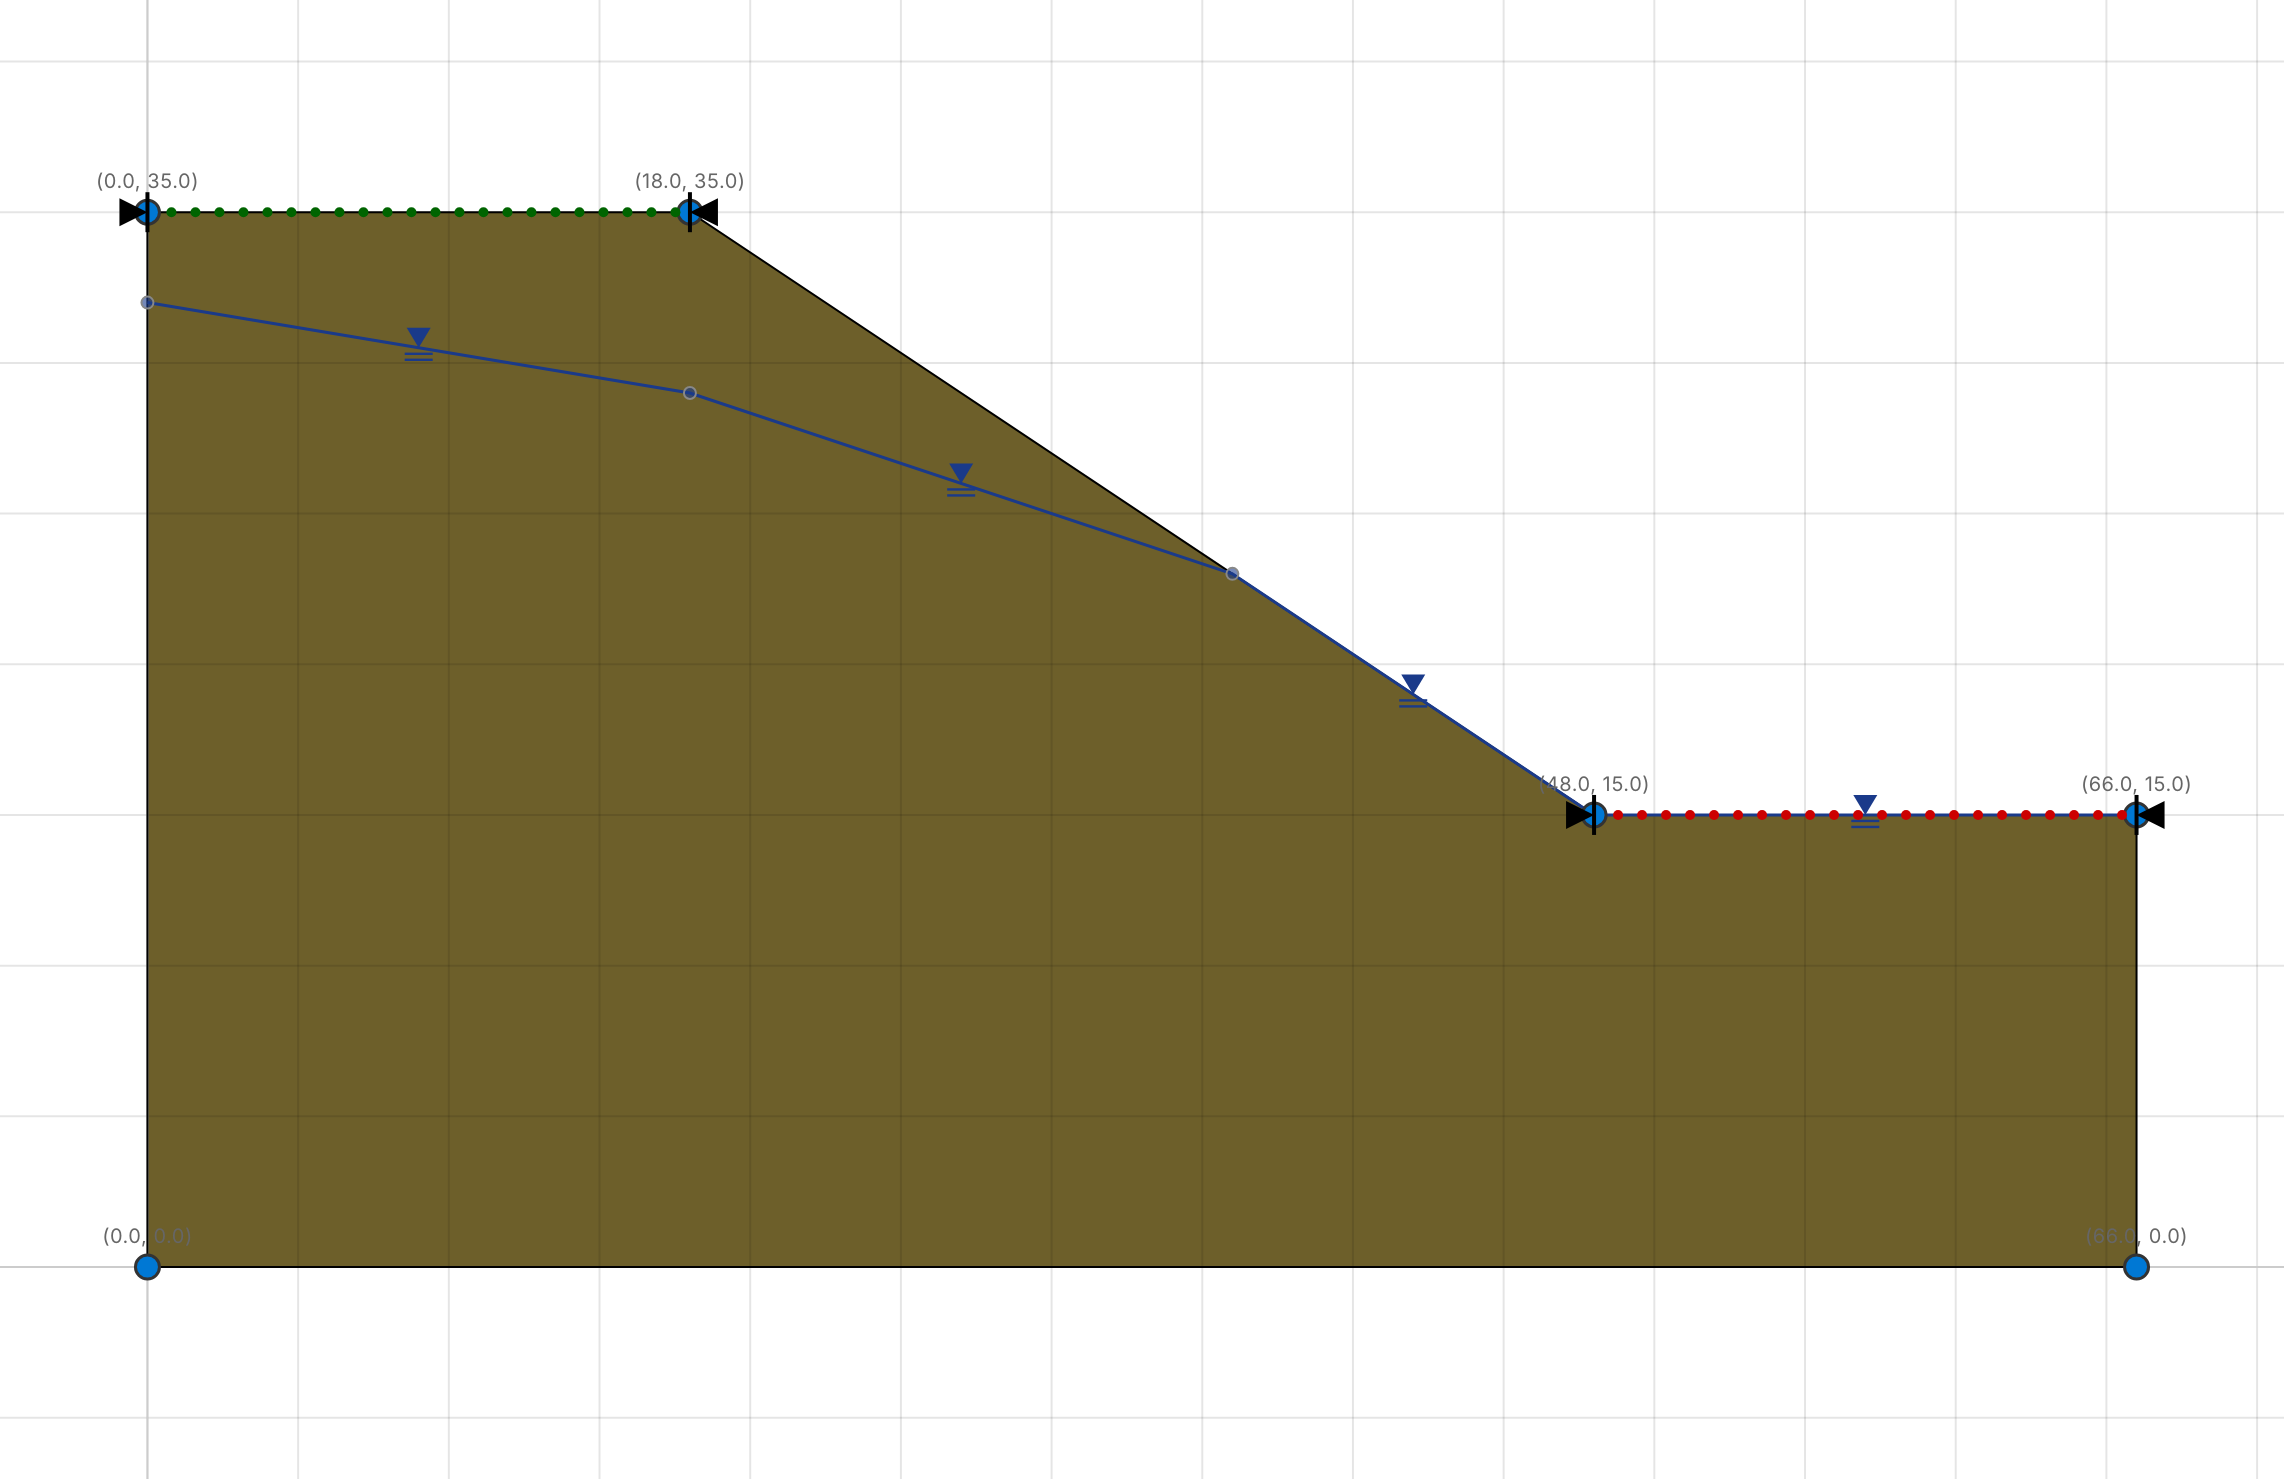
A 20 m high slope in one soil (γ = 18.82 kN/m³, c = 41.65 kPa, φ = 15°), with a water table that falls from 3 m below the crest to the ground surface at the toe.
2. The piezometric line
Open Model › Water Pressure › Piezometric Lines. The model has one line, Water Table, with five points.
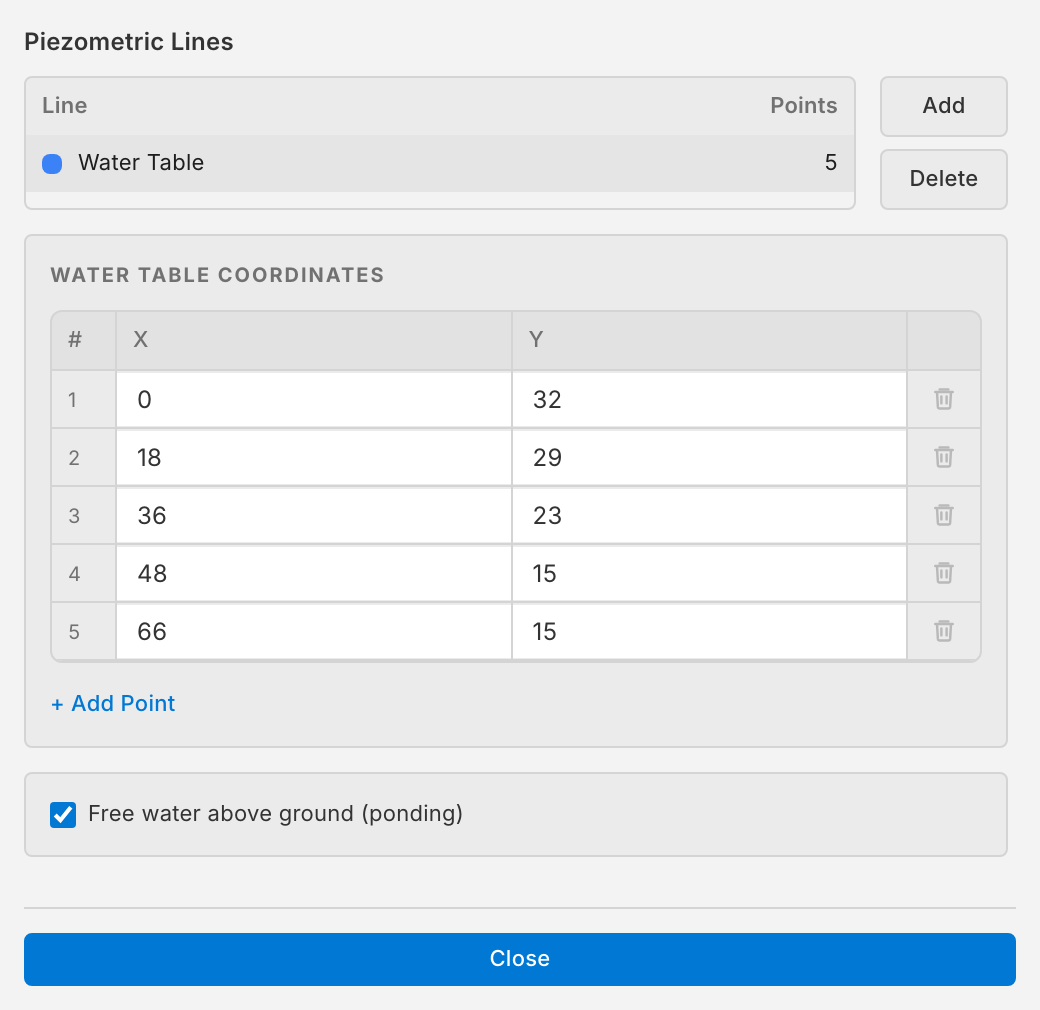
To make your own: click Add for a new line across the model, then edit its points in the table or drag them on the canvas. Right-click the line on the canvas to add a point.
Where the line is above the ground surface, Free water above ground (ponding) lets the water stand on the slope and load it. Here the line meets the ground at the toe, so no water is ponded.
3. Run
Click ▶ Run.
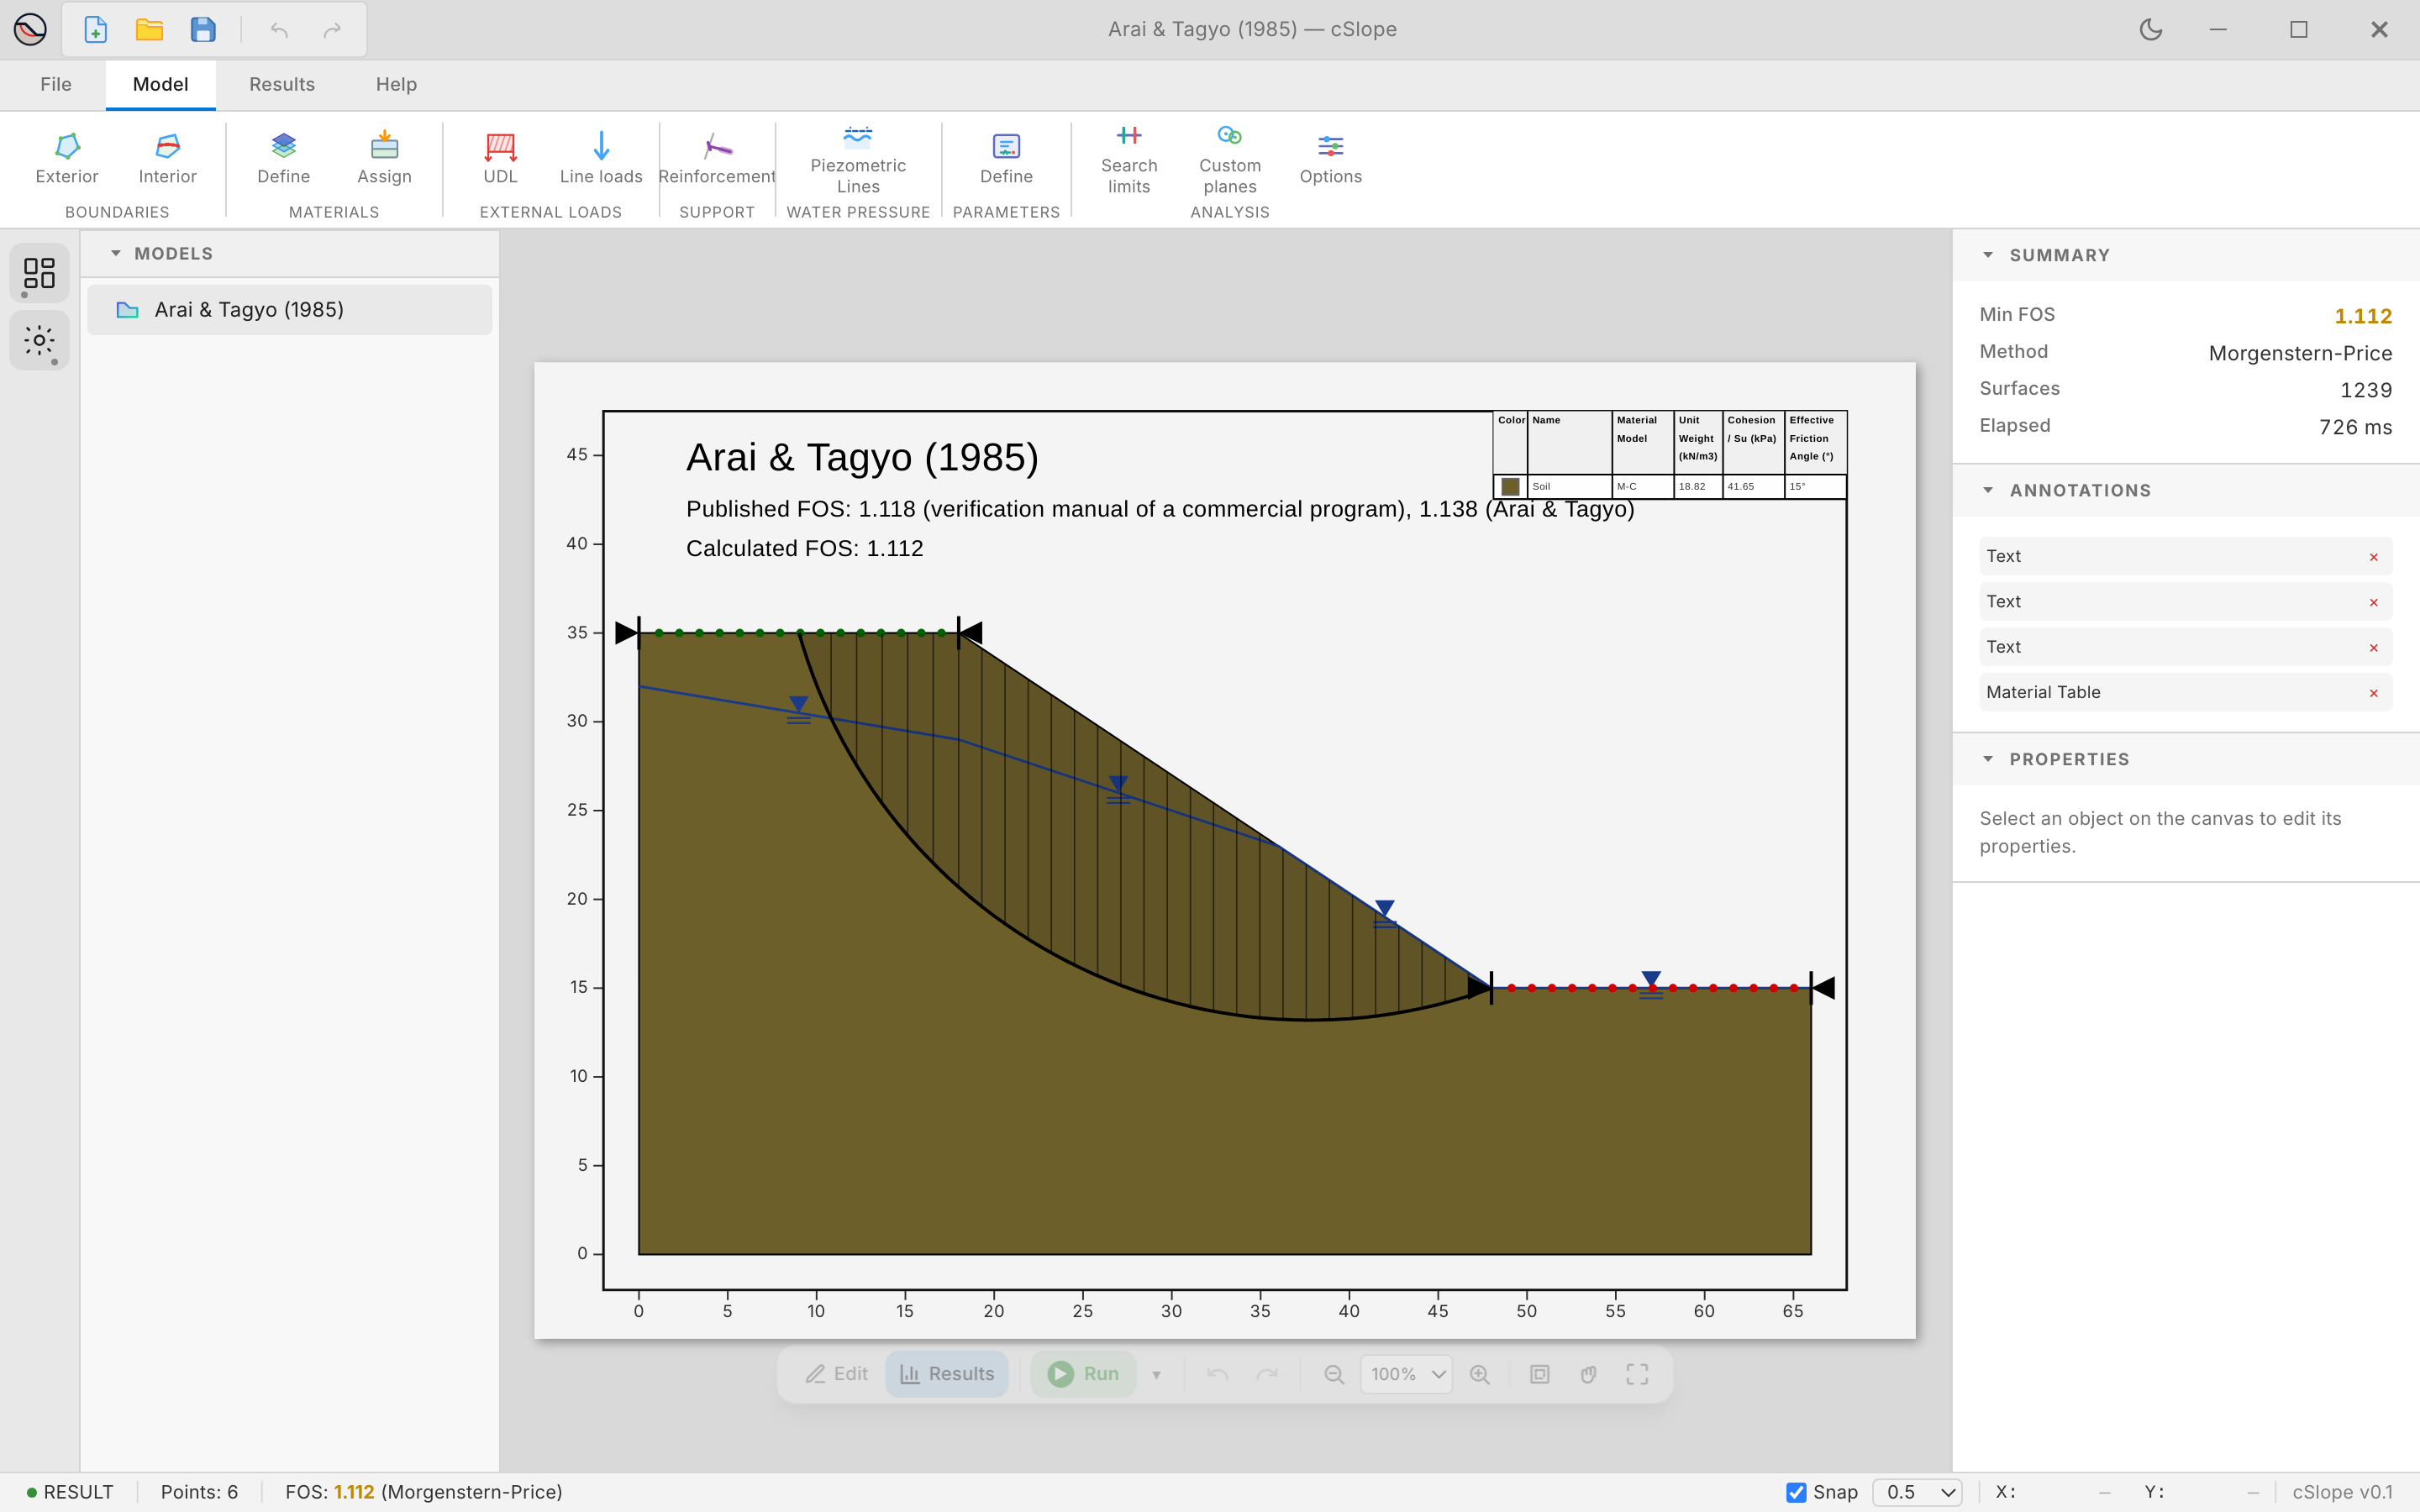
cSlope finds a factor of safety of 1.112 with Morgenstern–Price. The published values are 1.138 (Arai & Tagyo) and 1.118 (from a commercial program's verification manual).
4. Pore pressure along the slip surface
Choose Results › Plots › Results Plot and set Y axis to Pore pressure:
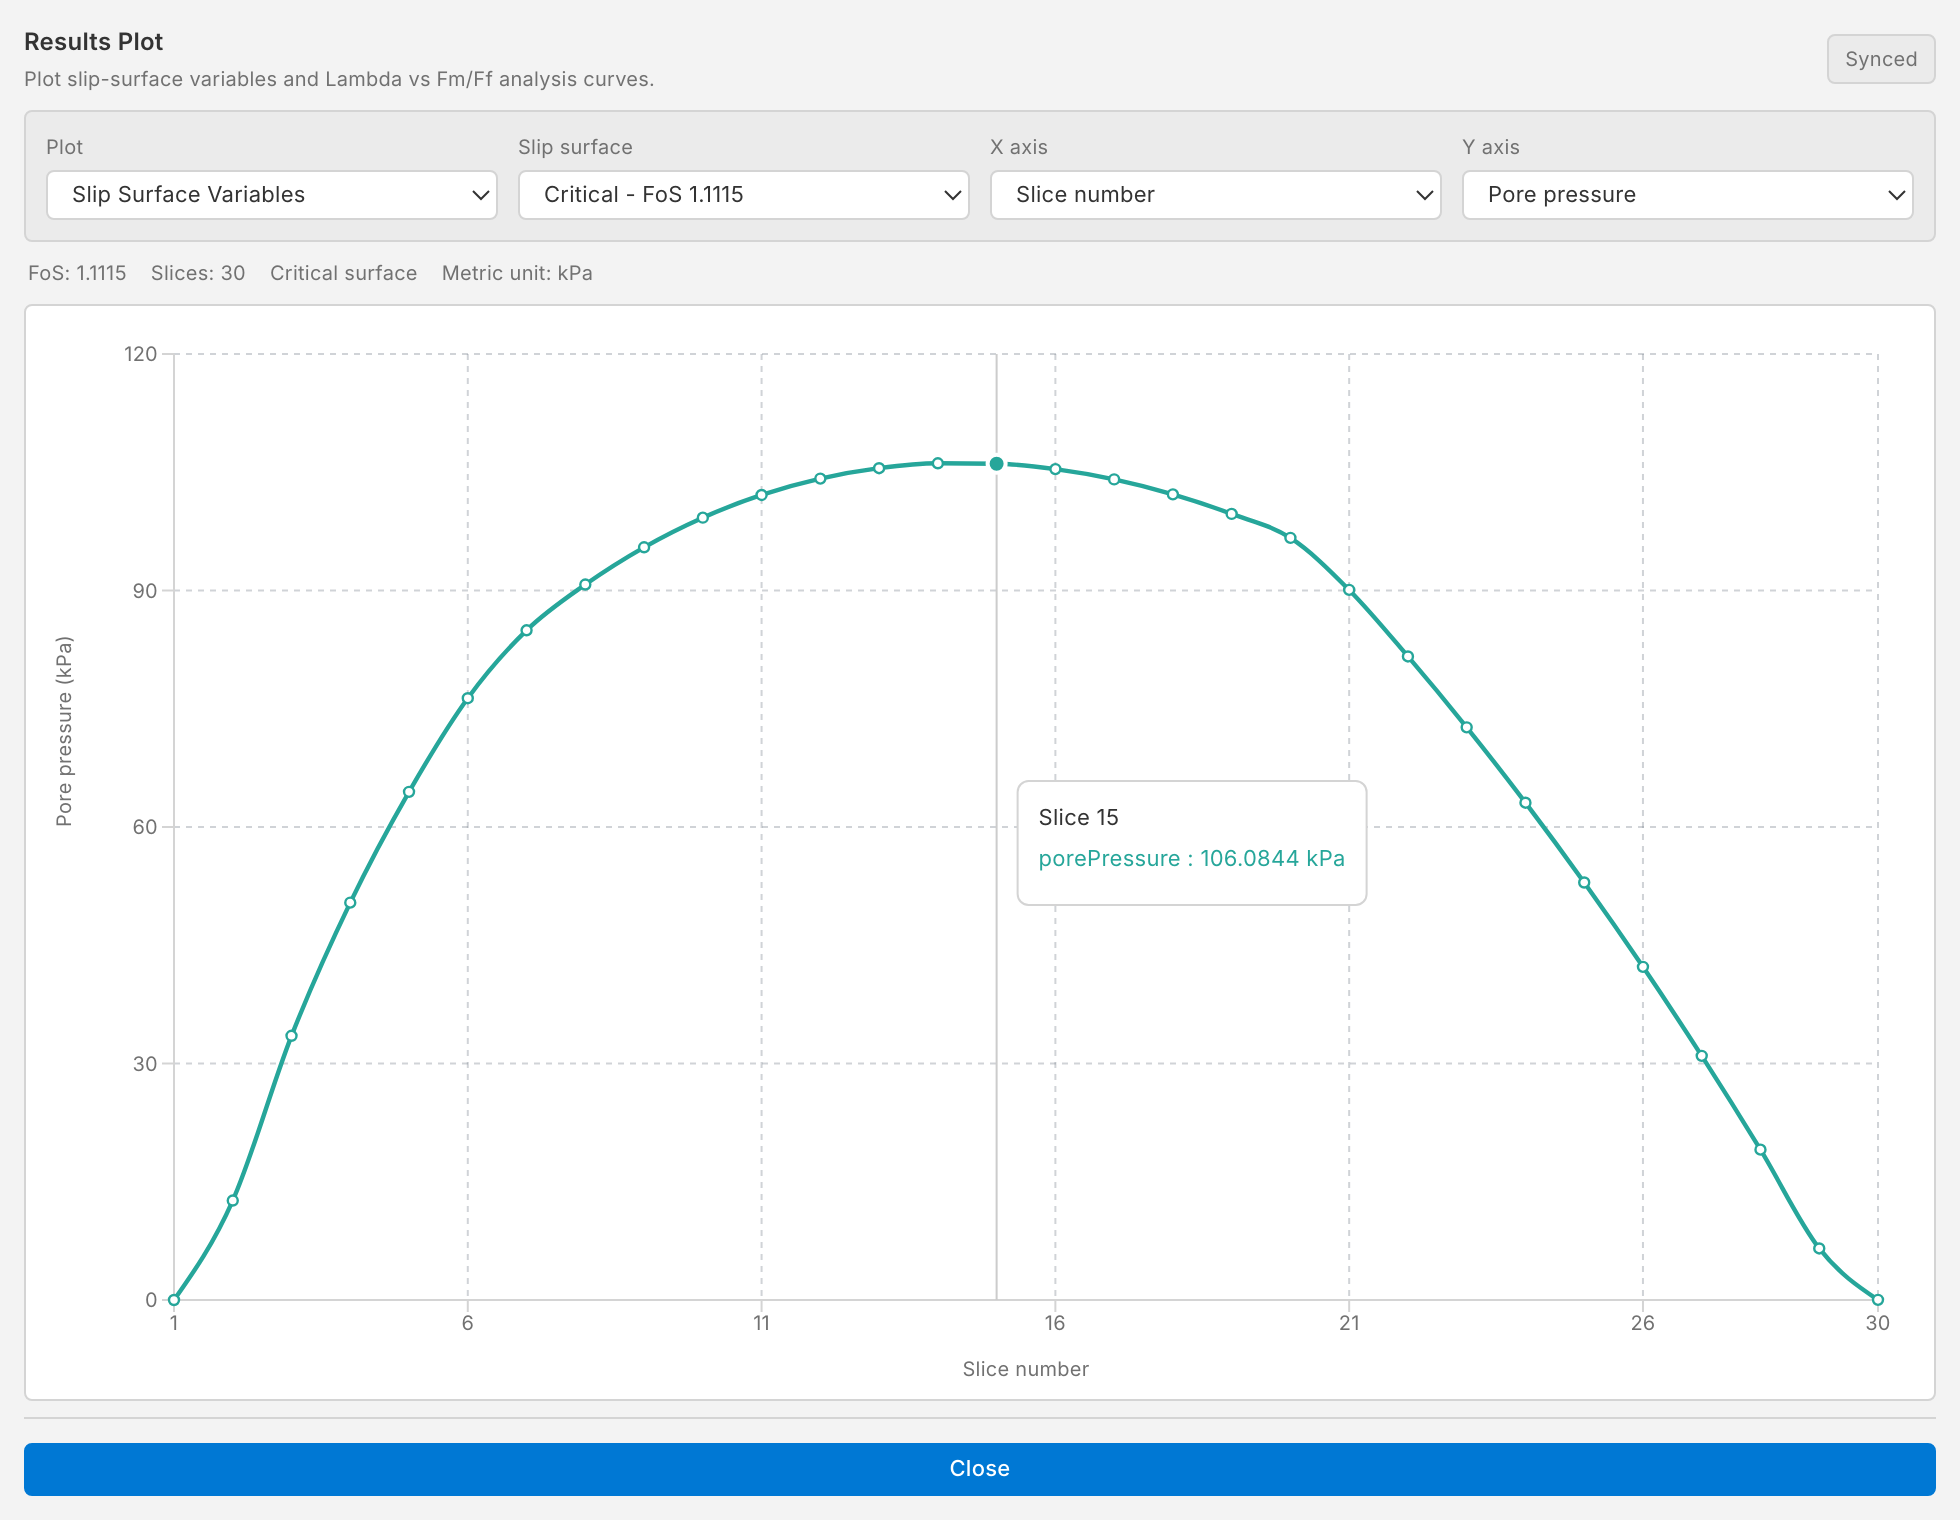
The plot window can show any quantity along any analysed surface, not only the critical one.
5. Try it
- Drag the water table down by a few metres and run again: the factor of safety rises.
- Choose Phreatic correction under Pore pressure below an inclined water line in the options, run again and compare.
More in Water.